Thursday, December 2, 2021

‘Tis the Season for Giving!

Can you believe December is already here?
statistics-in-schools-banner-headline

Statistics in Schools brings subjects to life using real-world Census Bureau data to create materials for use year after year at all grade levels.

'Tis the Season for Giving!

Can you believe December is already here? As your students partake in seasonal festivities and count down to their winter break, Statistics in Schools (SIS) can help keep them engaged in learning with fun activities they'll love. This month, we give you our Festive-Name Places warm-up activity, ideas for teaching holiday-related facts, and our refreshed State Facts for Students interactive data tool.

Festive-Name Places Warm-Up Activity

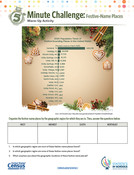
Festive-Name Places

With the holidays upon us, help get your students in the spirit with our Festive-Name Places warm-up activity! Students will examine a graph with population estimates for places like Santa Claus, IN, and Rudolph, WI, and organize the places by geographic region. Then, they will answer questions about which regions have the most and least number of festive-name places.

Learn More

Holiday Season Fun Facts and Teaching Guide

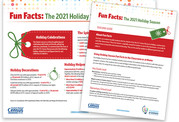
Holiday Season Fun Facts

Did you know that in 2020, Cambodia led the way with approximately 60% of U.S. imports of Christmas tree lights?

Our newly updated Holiday Season Fun Facts worksheet is great for helping keep students interested in learning during this exciting time of year. It showcases festive data on imports of holiday decorations, the number of selected specialty stores across the country where you can purchase gifts, and more. The accompanying teaching guide provides activity ideas for all grade levels.

Learn More

In Case You Missed It: Refreshed State Facts for Students Tool

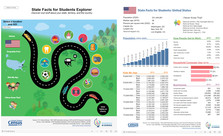
State Facts for Students Explorer and Table

Did you see the announcement about the refresh of our fan-favorite data access tool, State Facts for Students? It's the perfect tool for students to explore leading up to the holidays. Students can look at national and state data in the familiar table view or with a visualization of interesting facts along a colorful road. With this tool, they can discover information about their state's population, geography, businesses, and history, or look at data changes over time. Cool fact: In 2010, there were 404 ice cream and frozen dessert makers in the U.S. and in 2019 that number increased to 441.

Here are some activities that use State Facts for Students:

Elementary Math:

Elementary Geography:

Elementary/Middle English:

Share Button

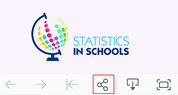
Reminder: Please be sure to update any bookmarks or links to the State Facts for Students tool. To save a specific state link, select the "Share" icon on the menu at the bottom of the tool when viewing that state. Make sure the "Current View" tab at the top is highlighted. Copy the link and paste it into your browser to save it as a bookmark.

Learn More

Monthly Highlights Page

December Monthly Highlights

Check out our Monthly Highlights page for more activities related to observances in the coming weeks!


Learn More

Share This

About Statistics in Schools

We provide more than 200 activities and resources for teaching and learning with real-life data. Enhance and invigorate learning in many subjects while educating your students about the value and everyday use of statistics. Visit census.gov/schools to learn more and explore standards-aligned, classroom ready activities.


This is an official email from the U.S. Census Bureau. If you have any questions or comments, please contact us (http://www.census.gov/about/contact-us.html).  

No comments:

Post a Comment

End of Summer Sale ☀️😎

20% OFF Inside!🀯 ͏  ͏  ͏  ͏  ͏  ͏  ͏  ͏  ͏  ͏  ͏  ͏  ͏  ͏  ͏  ͏  ͏  ͏  ͏  ͏  ͏  ͏  ͏  ͏  ͏  ͏  ͏  ͏  ͏  ͏  ͏  ͏  ͏  ͏  ͏  ͏  ͏  ͏...